Boston Consulting Group Matrix Explained
The Boston Consulting group’s product portfolio matrix (BCG Matrix) is designed to facilitate an organization’s long-term strategic planning, to aid the company to analyze growth opportunities by reviewing its portfolio of products to decide where to invest, discontinue, or develop products. BCG Matrix is also referred to as Growth/Share Matrix.
For big corporations, they have a corporate strategy that is a strategy for the entire corporation. But then they also need to make business strategies relevant to specific businesses division also called Strategic Business Unit (SBU)
One of the big reasons for using the Boston Consulting Group Matrix is that it helps allocation of resources to different business units. Because of the prevailing market condition, some business units might be doing really well, and others might be struggling. If the business is struggling, resources can be diverted towards that struggling business.
These resources are usually from the business units that are performing well.
Portfolio Analysis
When the company has different business units, they have portfolios, they need to analyze the portfolio to decide how to allocate resources.
Portfolio analyzes will help an organization understand which of the portfolio of products might help achieve the goals.
Companies do it because they have a bunch of products and some of those products might be doing well, others may not doing well. Again, there might be more demand for certain products than certain other products.
Businesses need to figure out which product they are doing well and which product the consumers are demanding.
BCG Matrix Example of McDonald’s
If you own a McDonald’s restaurant, then the portfolio of products you offer to the consumers may include;
- A portfolio of burgers
- A portfolio of soft drinks
- A portfolio of chicken nuggets
Therefore, when you do portfolio analyzes, you try to figure out which one of these products has a higher demand? Is the market growing, or is the demand becoming stagnant or declining?
💥🎁 New Year & Easter Deals On Amazon !
Don't miss out on the best discounts and top-rated products available right now!
🛒 Shop Now and Save Big Today!*As an Amazon Associate, I earn from qualifying purchases.
It will help in terms of your planning because you want to focus your resource is on the products that are doing really well, and that is what portfolio analysis is all about. BCG Matrix helps the company do the portfolio analyses to understand where the market is trending and where they should allocate their limited number of resources.
Axis of BCG Metrix
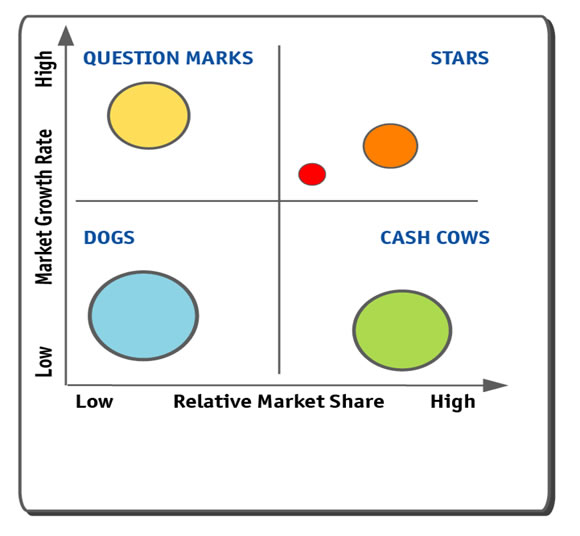
BCG matrix consists of two axis: The X-axis and the Y-axis, and the two factors that go into the BCG matrix are relative market share and market growth rate.
On the vertical axis, the market growth rate provides a measure of market attractiveness. On the horizontal axis, the relative market share serves as a measure of company strength in the market.

The market growth rate is about how much is the industry growing, e.g., how much is the beverage division growing every year?
Relative market share is about how much market share the business has compared to the top competitor.
Example Samsung; the relative market share of Samsung phone manufacturer in relation to the competitors is high in the United States compared to Nokia. The relative market share for Nokia will be very small.
Boston Consulting Group Growth-Share Matrix Examples
The four quadrants relate to whether or not a company has a high market share or low market share and whether or not the company operates in an industry with a high growth rate or low growth.
BCG Matrix Dogs
Dogs are low growth, low share businesses and products. They may generate enough cash to maintain themselves but do not promise to be large sources of cash.
💥🎁 New Year & Easter Deals On Amazon !
Don't miss out on the best discounts and top-rated products available right now!
🛒 Shop Now and Save Big Today!*As an Amazon Associate, I earn from qualifying purchases.
The circles in the growth-share metrics represent the company’s current SBUs. The areas of the circles are proportional to Strategic Business Unit’s dollar sales.
Companies should invest in the more promising question marks to make them stars and maintain the stars to become cash cows as their markets mature. Income from cash cows helps to finance the company’s question marks, stars, and dogs.
What does dog symbolize in BCG Matrix?
The quadrant is called a dog because the market is not growing and at the same time the product/brand /business is a very small player in the market, and are pinched between two big negatives. The market is not growing, and the business is a small player in the market.
BCG Matrix Question Marks
Question marks are low share business units in high growth markets. They require a lot of cash to hold their share, let alone increase. Management has to think hard about which question marks it should try to build into stars and which should be phased out.
It’s a question mark because the business unit may or may not survive, depending upon their strategies. There are some opportunities if the market is growing because there is growth even though it is a small player.
If the market is growing, then the competitive pressure will be less because the pie is getting bigger since the pie is getting bigger. Even if the bigger competitors take a bigger share of the pie, the business share of the pie is also getting bigger, even though it is smaller than the big.
When the SBU is in the question mark, it needs to increase the market share because the market is growing rapidly.
Examples of Question Marks in BCG Matrix
A good example of question marks in BCG Matrix is the tablet from Philips. Because the market is growing very fast, it requires a lot of marketing resources to try and gain market share as well as meet the growing demand. The question mark is sometimes called ‘problem child’ and take market share from other competitors and grow bigger, propelling it to another quadrant.
BCG Matrix Stars
Stars are high growth, high share businesses or products. They often need heavy investments to finance their rapid growth, and eventually, their growth will slow down, and they will turn into cash cows.
The problem that the SBU will face in this situation is that it needs to continue to spend a lot of resources to maintain the market share. This is on advertising, marketing, research, development, and retaining the customers they already have.
💥🎁 New Year & Easter Deals On Amazon !
Don't miss out on the best discounts and top-rated products available right now!
🛒 Shop Now and Save Big Today!*As an Amazon Associate, I earn from qualifying purchases.
When they start losing their market share, then, they will be pushed back from the start to a question mark quadrant.
Examples of stars in BCG Matrix
A good Example of stars in BCG Matrix is Apple Inc Company when dealing with iPhones. Think about the smartphone industry when Apple came out and then the smartphone sales were going through the roof, they were growing year by year and, Apple was the biggest player.
Apple was making a lot of money because the market is growing rapidly, and was also a big player in that niche market.
BCG Matrix Cash Cow
What do Cash Cows Symbolize in BCG Matrix?
Cash cows represent low growth but high share businesses or products. It symbolizes that the cow (business ) can be milked (generate revenue). These established and successful SBU need less investment to hold their market share; thus, they produce a lot of the cash that the company uses to pay its bills and support other Strategic Business Unit that need investment
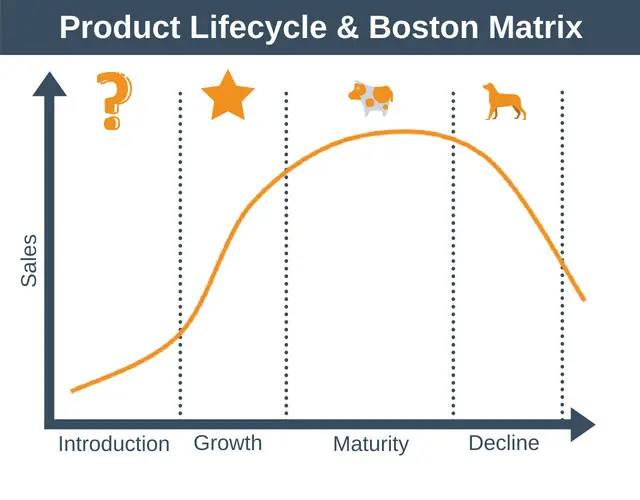
Since the market is not growing, the product may be in the maturity and decline stage ( Product life cycle); organizations don’t need to spend a lot of money on advertising. Simply because of a big brand in an industry that’s matured.

Examples of Cash Cows
A good example of Cash Cow is Apple products like iPhones/Ipods. Does Apple need to advertise a lot to its consumers to sell its iPhones? No, because consumers already know who Apple is and what Apple products bring to the table compared to other companies.
The best quadrant for a company to have its products is in the stars section because the market growth rate is high and they have a big market share, and it is a brand that will continue to generate revenue in the future.
Eventually, it will go down to the cash cow quadrant, and then it will then have more cash, but the problem with cash cow is it’s generating a lot of cash right now, but if the industry is in decline and the industry may disappear completely.
💥🎁 New Year & Easter Deals On Amazon !
Don't miss out on the best discounts and top-rated products available right now!
🛒 Shop Now and Save Big Today!*As an Amazon Associate, I earn from qualifying purchases.
Example of BCG of Apple
Apple has a portfolio of products, including laptops, tablets, iPad, iPods, smartwatches, smartphones, Apple TV, and Apple credit cards.
All these different products in Apple’s portfolio and doing portfolio analyzes and decide which business unit or product in each BCG Matrix. It will help Apple dedicate its resource allocation for various product lines based on their Matrix performance.
Apple can decide how they will allocate resources in trying to maintain its cash cows, take the money from the cash cow and then reinvest the money into their question mark to try to push them into being stars. Again, they can spend that money on stars to try to maintain its position as a star.
Boston Consulting Group Matrix Strategy/ BCG Matrix Strategy Recommendation
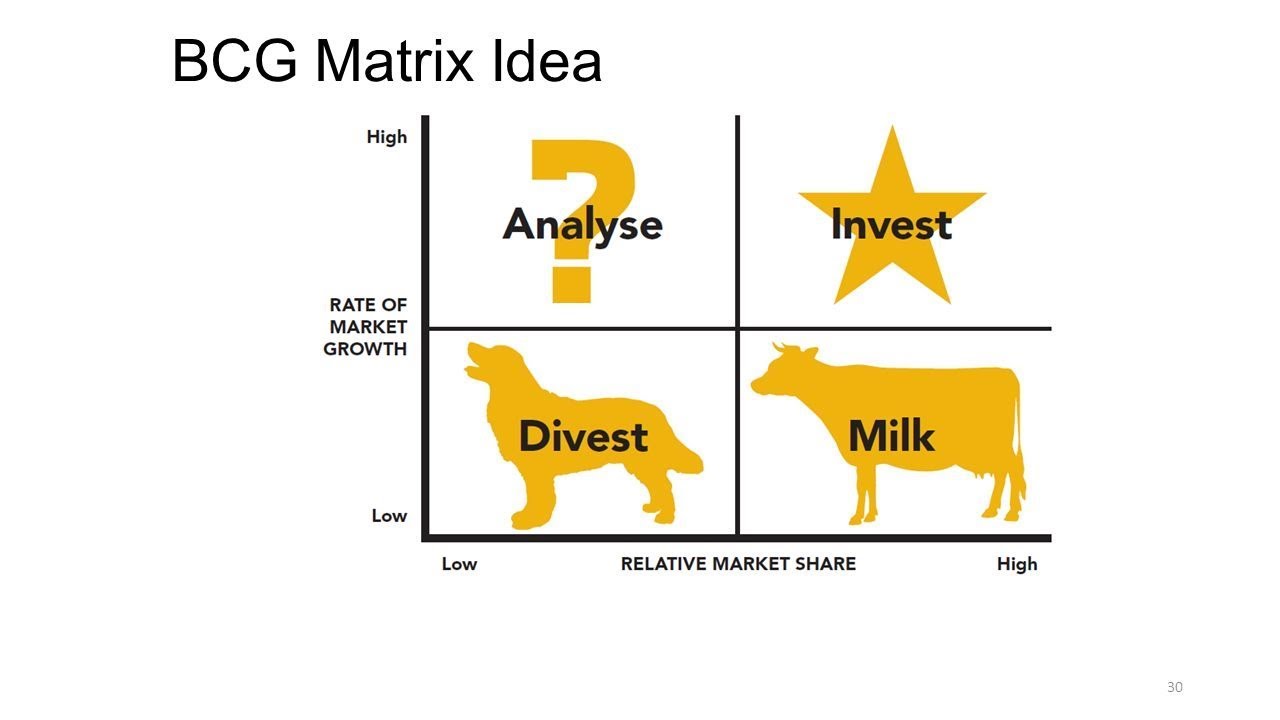
Once it has classified its Strategic Business Unit, the company must determine what role each will play in the future. It can pursue one of the four strategies for each Strategic Business Unit.
- It can invest more in the business unit to build its share
- it can invest just enough to hold the Strategic Business Unit share at the current level.
- It can harvest the Strategic Business Unit milking its short-term cash flow, regardless of the long-term effect.
- It can divest the Strategic Business Unit by selling it or phasing it out and using the resources elsewhere.
As time passes, Strategic Business Unit change their positions in the growth-share metrics. Many Strategic Business Unit starts out as question marks and moves to the star category if they succeed; they later become cash cows as market growth falls and then finally die off or turn to dogs towards the end of their life cycle.
The company needs to add new products and units continuously so that some of them will become stars and eventually cash cows to help finance other Strategic Business Unit.
Limitations of BCG Matrix / Problems with BCG Matrix Approaches
- The BCG and other formal methods revolution realized strategic planning; however, such centralized approaches have limitations. They can be difficult, time-consuming, and costly to implement. Management may find it difficult to define Strategic Business Units and measure market share and growth.
- Besides, these approaches focus on classifying current businesses but provide little advice for future planning.
- Because of such problems, many companies have dropped formal metrics methods in favor of a more customized approach is that better suits their specific situations.
- Moreover, unlike former strategic planning efforts that rested mostly in senior managers’ hands at company headquarters, today’s strategic planning has been decentralized.
- Increasing companies are placing responsibility for strategic planning in the hands of cross-functional teams of divisional managers who are close to their markets.


