Isoquant Curve Example & Isocost Line
Isocosts Curve & Isocost Line
An isocost line shows the different combinations of two inputs that a firm can buy for a given sum of money at the given price of each input.
A curve showing the combinations of factor inputs that have constant market cost. If firms are acting as price-takers in factor markets, the isocost curve is a straight line, whose slope represents the relative prices of different factors’ services.
Why are isocost lines straight lines?
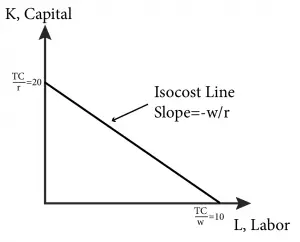
The slope of the isocost line is the ratio of the input prices of labor and capital. If input prices are fixed, then the ratio of these prices is clearly fixed and the isocost line is straight.
An isocost line is a line that represents all combinations of a firm’s factors of production that have the same total cost.
Factors of production are generally classified as either capital (K) or labor (L). Wage (W) is the price a firm has to pay for labor and rent (r) is the price it has to pay for capital.
An isocost line (equal-cost line) is a Total Cost of a production line that recognizes all combinations of two resources that a firm can use, given the Total Cost (TC). Moving up or down the line shows the rate at which one input could be substituted for another in the input market.
You can represent the total costs of production with an isocost line. The isocost line is a firm’s budget constraint when buying factors of production.
To calculate the isocost line for a firm, begin with the total cost equation,
For the case of Labor and Capital, the total cost of production would take on the form:
TC = (WL) + (RK) or TC = (W x L) + (r x K) and solve for K.
where TC= Total Cost, W= Wage, L= Labor, R= Cost of Capital, K= Capital
The slope of an isocost line represents the cost of one factor of production in terms of the other.
The assumption is that firms are Rational and want to minimize costs; that is, they want an isocost line close to the origin
The isocost line represents all combinations of capital and labor that have the same total cost. Therefore, any values of capital and labor that the firm can choose must satisfy the equation on the left that you previously derived.
Shift in Isocost Line
An isocost line may shift due to two reasons. They are
- Change in total outlay to be made by the firm
- Change in price of a factor-input
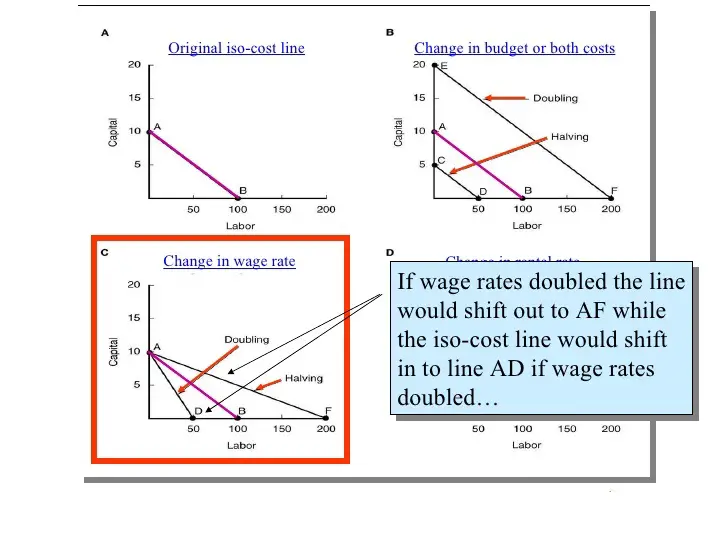
 Because isocost lines are determined by the budget, any change in a firm’s total budget would cause the budget to shift in or out, as shown on the left. An outward shift represents an increase in the budget (right graph), and an inward shift represents a decrease in the budget (left graph). The middle graph on the left shows the original isocost line.
Slope of Isocost Line
The slope of the isocost line represents the relative prices of the inputs, labor and capital. When the price of one changes relative to the price of the other, the line does not shift, but the slope changes.

The slope of the isocost line is W/r or the relative price of the inputs. W/r is the opportunity cost of labor; that is, it tells the firm how many units of capital it has to forego to get another worker.
In the lower panel on the far left, the price of capital has increased relative to labor, making labor relatively cheaper.
In the lower far right graph, the price for labor has increased making labor relatively expensive. The middle graph is the original isocost line.
Properties of Isocost Line
- The isoquant is downward sloping from left to right i.e. it is negatively sloped.
- The isocost line is a combination of two factors that the firm will choose for production.
- Higher isocost lines represent higher outlays (total cost) and lower isocost lines represent lower outlays.
- The isocost shows all the combinations of input available at a fixed cost.
Cost Curve Example
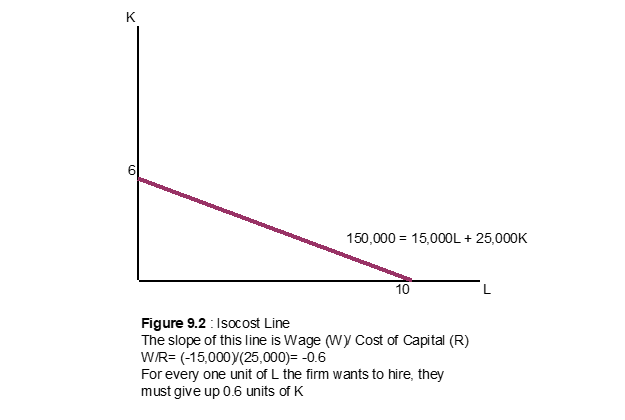
Example of Isocost: A company producing widgets encounters the following costs- the cost of capital is $25000, labor cost is $15000, and the total cost the firm is willing to pay is $150,000.
To show the isocost line graphically.

The equation represented by the data is: 150,000= (15000)L + (25000)K
Setting L=0, we find the y-intercept to be K=6. Setting K=0, we find the x-intercept to be 10.


