Lorenz Curve and Gini Coefficient
What is Lorenz Curve?
It is hard to imagine a more simple and elegant graph than the Lorenz Curve. The curve was developed by an American economist, Max Lorenz, in 1905. It plots wealth or income against the horizontal axis population, while the vertical axis depicts income or wealth.

The Lorenz curve is a representation of wealth and income distribution. The closer the curve is to the line, the more balance there is in how we are allocating the resources.
The Lorenz curve is a graphical representation of the degree of equality/inequality in income distribution.
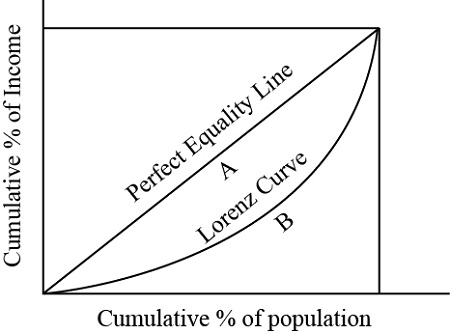
The curved line represents a Lorenz curve, which plots the cumulative percentage of income recipients, ranked from poorest to richest, against the cumulative percentage of total income.
A perfectly equal income distribution would be one in which every person has the same income. The straight line y = x can depict this, called the “line of perfect equality.”
Along the straight-line diagonal, there is an equal distribution of income, such that the poorest 10% will receive 10% of total income and so on. This becomes increasingly asymmetrical as you move away from this point.
If the actual relationship between the two variables were to follow a path similar to the curved line, this would indicate an unequal distribution of income. For instance, on the graph, in this particular instance, the bottom 20% of income earners command 5% of total income, while the richest 20% obtain 40% of total income.

Gini Coefficient Equation
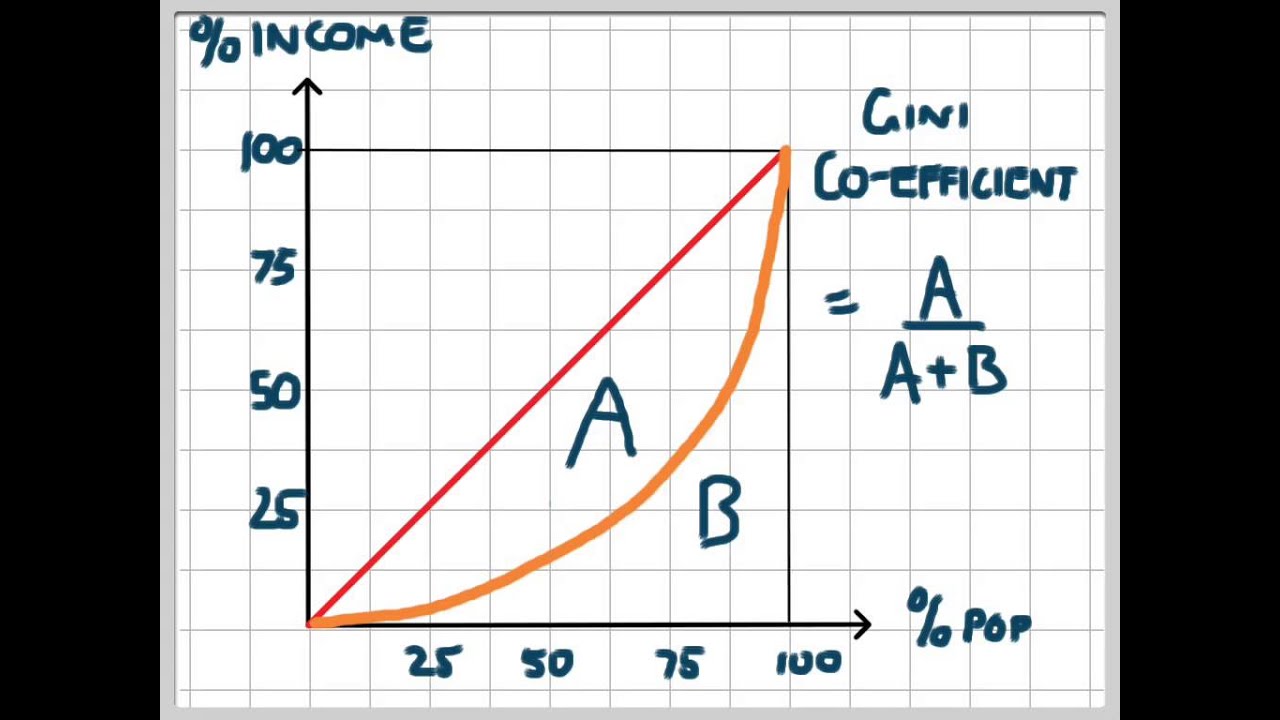
The ratio between areas A and B on the graph is known as the Gini coefficient.
💥🎁 New Year & Easter Deals On Amazon !
Don't miss out on the best discounts and top-rated products available right now!
🛒 Shop Now and Save Big Today!*As an Amazon Associate, I earn from qualifying purchases.
Thus G=A/(A+B)
Where G is the Gini coefficient, A is the area between the Lorenz curve and the diagonal, and B is the area below the curve.
If there is completely equal income distribution, the G=0 (or A=0) and the Lorenz curve is a diagonal line. The distribution of income becomes more unequal as G increases. It gets closer to 1, and this could occur. For example, if more people received nothing, the Lorenz curve’s lower end would move rightwards along the horizontal axis.
As 100% of the population must receive 100% of total income, the top right-hand end of the Lorenz curve must touch the diagonal’s top right-hand end.
However, if the top quintile groups obtain a higher proportion of income, the Lorenz curve will bulge further to the right in its upper regions before it reaches the top right-hand corner.
In the hypothetical extreme where one person earned all the money and everyone else obtained nothing, the area below the Lorenz curve would disappear, and G would be very near to 1. Thus G will lie between 0 and 1, and the greater it is, the more the inequality.
The higher the Gini coefficient, the more unequally income is distributed.
Gini coefficient Explained
The Gini coefficient is a measure of the inequality in wealth distribution, which has been developed by Italian statistician Corrado Gini and published in his 1912 paper.
The index is used to quantify income or wealth inequality within a country or inequality of a distribution. It is defined as a ratio with values between 0 and 1: the numerator is the area between the Lorenz curve of the distribution and the uniform distribution line; the denominator is the area under the uniform distribution line.
Gini Coefficient Advantages and Disadvantages
Gini Coefficient Advantages
- The Gini coefficient is a measure of inequality and does not misrepresent the population when used.
- The Gini coefficient is a significant indicator for measuring the income inequality among different population sectors. It can be used to compare income distributions across different population sectors as well as countries. For example, the Gini coefficient for urban areas differs from that of rural areas in many countries.
- Gini coefficient is quite simple in that it can be compared across countries and be easily interpreted. GDP statistics are often criticized as they do not represent changes for the whole population; the Gini coefficient demonstrates how income has changed for poor and rich. If the Gini coefficient is rising and GDP, poverty may not be improving for the majority of the population.
- The Gini coefficient can indicate how the distribution of income has changed within a country over a period of time; thus, it is possible to see if inequality is increasing or decreasing.
Gini Coefficient Disadvantages
- The Gini coefficient measured for a large economically diverse country will generally result in a much higher coefficient than each of its regions has individually. Consequently, the scores calculated for individual countries within the EU are difficult to compare with the entire US score.
- Comparing income distributions among countries may be difficult because benefits systems may differ. For example, some countries give benefits in the form of money while others give food stamps, which may not be counted as income in the Lorenz curve and therefore not taken into account in the Gini coefficient.
- The measure will give different results when applied to individuals instead of households. When different populations are not measured with consistent definitions, a comparison is not meaningful.
- The Lorenz curve may understate the actual amount of inequality if richer households can use income more efficiently than lower-income households. From another point of view, measured inequality may result from more or less efficient use of household incomes.
- As for all statistics, there will be systematic and random errors in the data. The meaning of the Gini coefficient decreases as the data becomes less accurate. Also, countries may collect data differently, making it difficult to compare statistics between countries.
- Economies with similar incomes and Gini coefficients can still have very different income distributions. This is because the Lorenz curves can have different shapes and yet still yield the same Gini coefficient.
- Only the Gini coefficient is quoted without describing the proportions of the quantiles used for measurement. As with other inequality coefficients, the Gini coefficient is influenced by the granularity of the measurements.