Marginal Benefit Curve | Marginal Benefit Formula
Marginal Benefit Curve
What is the Marginal Benefits Curve?
The marginal benefit curve is a graph that shows the relationship between how much you consume of a good and its total benefits. It is represented by the line’s slope on a graph, which can be calculated using calculus.
A consumer will stop consuming when they reach their optimal point, where the marginal benefit equals zero.
The slope of the marginal benefit curve at any point indicates the rate at which total benefits increase with respect to changes in input. Marginal cost curves are similar to marginal benefit curves, but they represent incremental costs instead of incremental benefits.
Many people often think that the marginal benefit curve is a straight line. The marginal benefit curve is actually curved, which is why many people think that it is straight. The benefit declines as the person consume more of the good.
One type of example would be meat. If a certain amount of meat you need to consume and eat more of the meat will make you feel icky, you will not continue to eat the meat.
Marginal Benefit Curve Slope
When the marginal benefit curve is downward sloping, this suggests that the marginal benefit’s upside is not worth the cost. This is because the marginal benefit curve is relatively flat at the end of the curve, which means that the marginal benefit does not significantly increase over time. In other words, the marginal benefits relatively level off and may not be worth the marginal costs.
Why is the marginal benefit curve downward sloping?
Marginal benefit is the additional benefit that one derives from an additional unit of input. It is derived from diminishing marginal utility, which states that the individual will derive less and less satisfaction from additional units. Marginal benefit curves are typically non-linear, as is the relationship between marginal benefit and quantity of input used.
The change in value gained from a good or service when an individual consumes one more unit; the slope of the individual’s demand curve at its point of intersection with the marginal utility curve.
Marginal benefits decrease as more units are produced for two reasons: fixed costs rise, and average total costs rise. Marginal benefit curves are generally downward-sloping because they reflect falling marginal utility from consuming additional units of a good or service.
The downward slope in a marginal benefit curve indicates that individuals are becoming less satisfied with an additional benefit received. As the quantity of a good or service is increased, the marginal utility of a good may decrease.
Marginal Benefit Formula
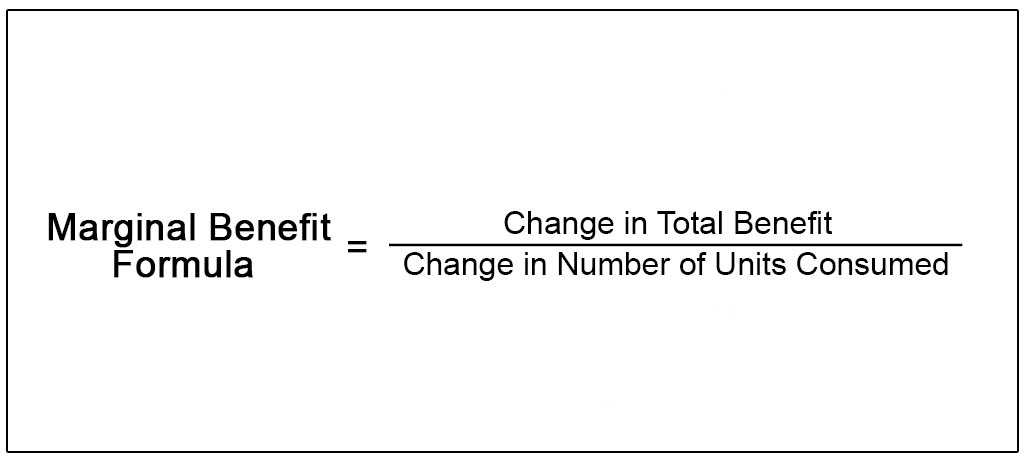
Marginal benefit is the change in total utility that occurs when a consumer increases consumption of one good by one unit.
The marginal benefit formula can be expressed as MB = ΔU/ΔQ, where ΔU is the change in total utility and ΔQ is the change in quantity consumed.
In other words, marginal benefits are measured as how much you gain from consuming more of something.

Marginal Benefit Curve examples
For example, an individual might have a marginal utility of 1 for the first apple and a marginal utility of 0.5 for the second apple. This is because adding one more apple, which is worth 1 in terms of benefits, can’t give as much utility as the first apple.
This is due to the law of diminishing marginal utility, which states that as a person consumes more of a good or service, the marginal utility that they derive from consumption of that good or service decreases.
Another example:
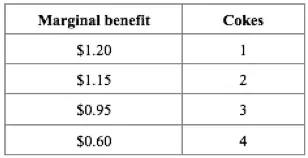
Assume that James can drink 1 or more cokes per day, then marginal benefit from drinking coke for a particular day is given in the table below.

This shows that she values the first coke she drinks at $1.20, the second at $1.15, and so on. This means that for each additional unit consumed, the consumer derives less and less satisfaction from it.
Why is the marginal benefit curve equal to the demand curve?
Demand curve as marginal benefit curve


