Isoquant Curve Example & Marginal Rate of Technical Substitution
What is an Isosqaunt?
An isoquant curve may be defined as a curve showing the possible combinations of two variable factors that can be used to produce the same total product
An isoquant is a graph showing combinations of capital and labor that a firm can use to produce a given output. Isoquant curve is a special type of curve that is used in Economics. An isoquant curve is a graphic representation of the relationship between two factors of production.
The two products (A & B) are typically assumed to be perfect substitutes, while all other factors that influence demand remain constant.
An isoquant curve maps out the combinations of product quantities in which quantity demanded for one good exactly equals quantity demanded any other good at different prices and given income or expenditure constraints.
Isoquant Curve Assumptions.
The isoquant concept is based on the following assumptions;
- Only two inputs (labor and capital) are used to produce a good.
- There is a technical possibility to substitute one input for another. It implies that the production function is of a variable type of proportion.
- Labor and capital can be divided.
- The producer must be rational, that is to say, maximize his profit.
- The state of the art of technology is not changed.
- The marginal rate of technical substitution decreases in the production process.
It is a curve that shows the combinations of certain inputs such as Labor (L) and Capital (K) that will produce a certain output Q. Mathematically; the isoquant curves is expressed by the function/equation
f (K,L) = Q
This equation basically says that the output that this firm produces is a function of Labor and Capital, where each isoquant represents a fixed output produced with different combinations of inputs.
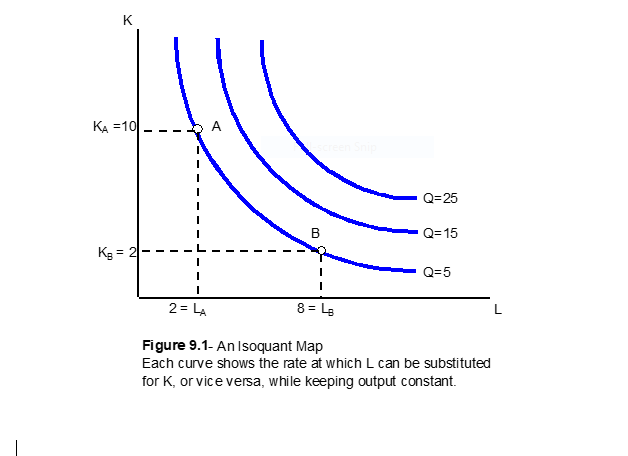
A new isoquant map can emerge for every level of output. Isoquants have certain properties that resemble that of indifference curves – convex to the origin, downward sloping, and nonintersecting curves.
💥🎁 New Year & Easter Deals On Amazon !
Don't miss out on the best discounts and top-rated products available right now!
🛒 Shop Now and Save Big Today!*As an Amazon Associate, I earn from qualifying purchases.
An isoquant map can help measure the diminishing return to scale. As output increases, each of the isoquants’ gaps will grow larger and larger until they appear as a large cluster.
This means that as output rises, it becomes more difficult for firms to substitute resources or inputs at will because there are not enough available resources.
Marginal Rate of Technical Substitution
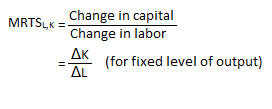
The marginal rate of technical substitution (MRTS) represents the rate at which one factor (labor) can be substituted for the other input (capital) in the production process of a commodity without changing the level of output or production.
The Marginal Rate of Technical Substitution (MRTS) equals the absolute value of the slope. The MRTS tells us how much of one input a firm can sacrifice while still maintaining a certain output level.
The MRTS is also equal to the ratio of Marginal Productivity of Labor (MPL)and Marginal Productivity of Capital (MPK). The mathematical form of how Labor (L) can be substituted for Capital (K) in production is given by:
Isoquant Curve example
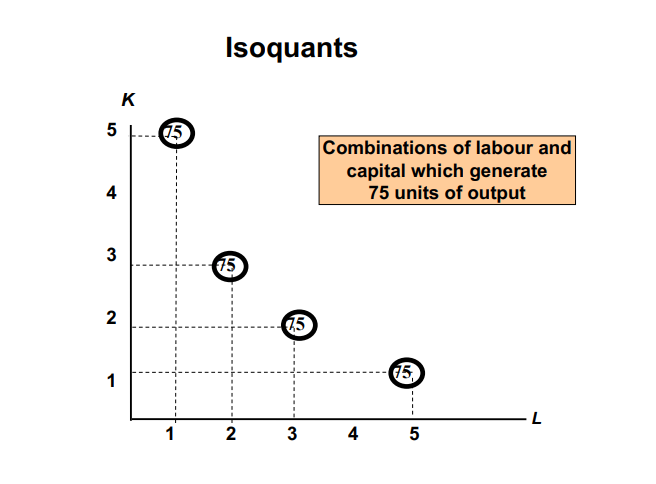
A firm could choose many different combinations of capital and labor that could produce a given quantity.
For example, on the left, suppose this firm decides to produce 75 TVs per week. It could combine capital and labor in any of the combinations on the schedule below.
| Labour | Capital |
| 5 | 1 |
| 3 | 2 |
| 2 | 3 |
| 1 | 5 |
By putting labor on the horizontal axis and capital on the vertical, you can plot some points and connect them to form an isoquant.
💥🎁 New Year & Easter Deals On Amazon !
Don't miss out on the best discounts and top-rated products available right now!
🛒 Shop Now and Save Big Today!*As an Amazon Associate, I earn from qualifying purchases.
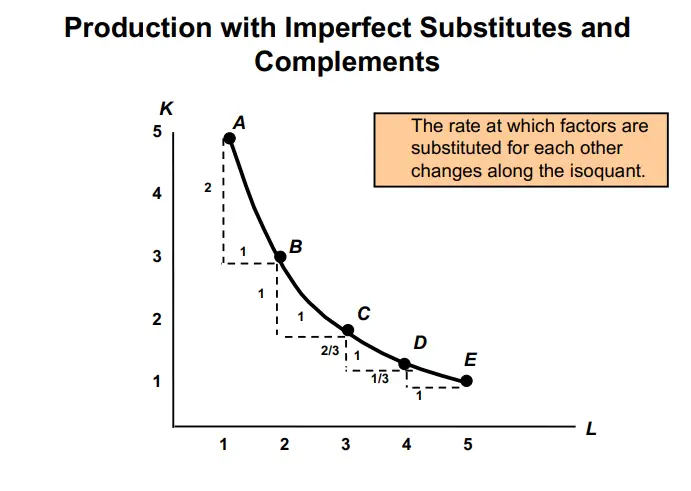
Points near the top of the curve represent capital-intensive technology, and points near the lower end represent labor-intensive technology.
The slope of an isoquant at any point is the slope of a tangent line at that point. The slope is called the marginal rate of technical substitution (MRTS).
Marginal rate of Technical Substitution
The marginal rate of technical substitution (MRTS) is the amount of capital a firm needs to substitute for one unit of labor to produce the same output amount.
It tells the firm how much capital is needed to replace a labor unit to maintain the output. On the left, it is rise over run and tells us the MRTS necessary to continue producing 75 TVs.
The most important point to remember about the slope is that there is a diminishing marginal rate of technical substitution. Near the top, where the MRTS is high, labor is scarce, and capital is abundant. To replace a worker, the firm must use a lot of capital.
At the lower end, the MRTS is low. Labor is abundant, and capital is scarce. It takes just a little capital to replace one worker in order to maintain the same output.
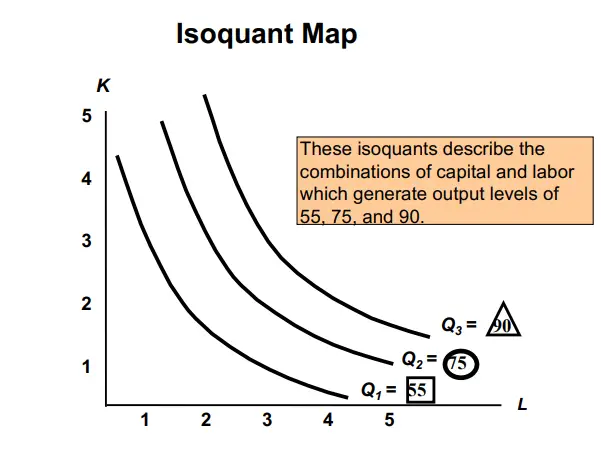
A firm can choose different output levels that require different combinations of inputs.
For example, on the left, if the firm wanted to produce 90TVs, its new isoquant would look similar to the Q3. If they intend to produce less, that is 55 units; then it will be similar to Q1.
💥🎁 New Year & Easter Deals On Amazon !
Don't miss out on the best discounts and top-rated products available right now!
🛒 Shop Now and Save Big Today!*As an Amazon Associate, I earn from qualifying purchases.
Indifference curve and Isoquant Curve
While indifference curve mapping helps solve the utilitarian-maximizing problem of consumers, isoquant mapping deals with producers’ cost-minimization problem.
In economics, an isoquant curve or indifference curve represents a set of bundles that give a consumer the same utility level. The consumer has an equal preference for all bundles on the curve. It can be used to illustrate either attainable or optimal production possibilities in limited circumstances.
Isoquants and Isocost Curves
Isoquants are typically drawn along the isocost curves in capital-labor graphs, showing the technological tradeoff between capital and labor in the production function and the declining marginal returns of both inputs.
Adding one input while holding the other constant eventually leads to decreasing marginal output, which is reflected in the isoquant’s shape.
The isoquant family can be represented by an isoquant map, a graph that combines several isoquants, each representing a different quantity of output. Isoquants are also referred to as equal product curves.